


Economic Value of Equity (EVE): Protection from Rising Interest Rates
Faced with rampant inflation, central banks worldwide are raising interest rates. In June, the US Federal Reserve announced its largest hike since 1994. The previous month, the Bank of England (BOE) had pushed UK rates to a 13-year high. The central banks of Brazil, Canada, and Australia have also hiked, and the European Central Bank (ECB) plans to follow suit later this month.
Such rate increases not only create turmoil in risk markets; they also can threaten a company’s financial stability.
The devil is in the details when quantifying how these hikes will influence a firm’s bottom line. Beyond the obvious implications on financing costs, capturing the impact on economic value requires a more strategic and holistic approach.
As we demonstrate here, the effect differs according to how heavy and active the company’s assets and liabilities are. The calculation becomes even more complex for finance or investment firms that juggle multiple balance sheets at once. Yet financial risk management and market risk hedging are critical to every firm’s prosperity, so analysts need to understand the available tools.
Economic Value of Equity (EVE)
Economic value of equity (EVE), or net worth, defines the difference between assets and liabilities according to their respective market values. EVE represents the income or loss a firm faces during the chosen horizon or time bucket. Hence, EVE reflects how assets and liabilities would react to changes in interest rates.
EVE is a popular metric used in the interest rate risk in banking book (IRRBB) calculations, and banks commonly measure IRRBB with it. But EVE can also help companies — and the analysts who cover them — calculate the risk to their dynamic assets and liabilities.
The metric looks at the cash flow calculation that results from netting the present value of the expected cash flows on liabilities, or the market value of liabilities (MVL), from the present value of all expected asset cash flows, or the market value of assets (MVA).
While EVE, as a static number, is crucial, what also matters to a company’s health is how EVE would change for every unit of interest rate movement. So, to calculate the change in EVE, we take the delta (Δ) of market values for both assets and liabilities. That is, ΔEVE = ΔMVA – ΔMVL.
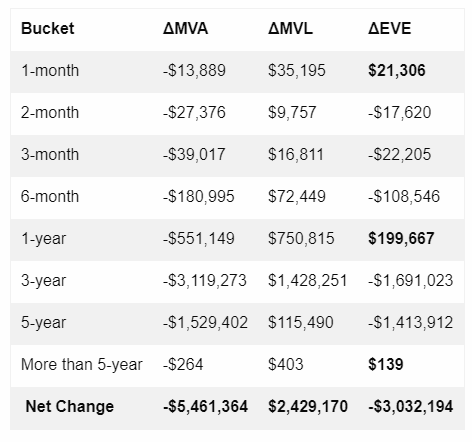
The beauty of this measure is that it quantifies the ΔEVE for any chosen time bucket and allows us to create as many different buckets as we require. The following table tracks the changes of a hypothetical company’s EVE assuming a 1 basis point parallel increase in interest rates.
What Is an Acceptable EVE?
Economic intuition tells us that long-term assets and liabilities are more vulnerable to interest rate changes because of their stickiness, so they are not subject to re-fixing in the short term. In the chart above, the net change in EVE is -$3,032,194 for every basis point increase across the interest rate curve, and we have the necessary granularity to determine the buckets where the company is most vulnerable.
How can a firm bridge this gap? What is the optimal allocation between the duration/amounts of assets and liabilities? First, every institution has its own optimal allocation. One size does not fit all. Each firm’s risk profile and pre-set risk appetite will drive the optimal EVE. Asset and liability management (ALM) is doubtless an art: it helps translate the company’s risk profile into reality.
Since EVE is primarily a long-term metric, it can be volatile when the interest rate changes. This necessitates applying market best practices when following a stressing technique, such as value at risk (VaR), that helps to understand and anticipate future interest rate movements.
On and Off the Balance Sheet
A company can manage the EVE gap between assets and liabilities — and the related risk-mitigation practices — either on the balance sheet or off it. An example of on-balance-sheet hedging is when a firm simply obtains fixed interest rate financing, rather than linking it to a floating index, such as US LIBOR, or issuing a fixed bond to normalize the duration gap between assets and liabilities.
Off-balance-sheet hedging maintains the mismatch in the assets and liabilities but uses financial derivatives to create the desired outcome synthetically. In this approach, many firms use vanilla interest rate swaps (IRS) or interest rate cap derivative instruments.
Details of the balance sheet gap are not always available for examination when reviewing the financial statements. However, decision makers and investors must pay attention to it and be vigilant because the EVE metric captures the market value of the cumulative cash flows over the coming years. And as we’ve shown above, calculating it is simple.
A Safety Valve for an Uncertain Future
With a little due diligence, we can better understand how a company manages its interest rate exposure and associated ALM processes. Although banks and large financial institutions make ample use of the EVE indicator, other companies ought to as well. And so should analysts.
When a firm sets limits for risks, monitors them, and understands the accompanying changes in value due to interest rate movements and how they will impact its financial position, it creates a safety valve that protects against market risks and an uncertain interest rate outlook.

Partner
