An Inverted Yield Curve – What Does it Mean?
Last month the Federal Reserve officially began pushing toward a tighter monetary policy. The Fed increased its benchmark interest rate by 25 basis points, the first since 2018. Relative to recent history, the pace of policy normalization is expected to be aggressive, with six additional hikes planned for this year. To maintain monetary stability, the Saudi Central Bank (SAMA) followed suit by raising its repo rate and reverse repo rate by 25 basis points.
Addressing reporters’ questions, the Fed Chair has stated that inflation is too high; the labor market is over-heated, and price stability is a “pre-condition” for the central bank as it confronts the toughest price pressures since the 1980s. As global recovery from the pandemic is still taking place, inflation has been accelerating at a different pace across several economies. In Saudi, the CPI index for inflation jumped to 1.6% in February 2022 year-over-year, up marginally from January’s 1.2% figure. In the U.S., CPI was up 7.9% (Y-o-Y) in February 2022, while prices paid to U.S. producers (measured by the Producer Price Index (PPI)) rose (Y-o-Y) by a significant 10%. It is reasonable to say that those figures are yet to reflect the economic disruptions resulting from the war in Ukraine, which are likely to increase inflationary pressures going forward.
As the Russia-Ukraine war intensifies in destruction, so does the impact it causes on the global economy. Elevated volatility levels across different asset classes have been the general theme since the conflict had erupted. This is especially the case with commodities, given that Russia and Ukraine produce and export a huge number of materials the world utilizes daily. From metals to agriculture, the ongoing conflict is limiting crucial supplies and driving up prices in the process. These current economic conditions are changing the shape of the yield curve.
THE INVERSION OF THE YIELD CURVE
The term yield curve refers to the relationship between the short- and long-term interest rates. Typically, it is a line that plots yields (i.e., interest rates) of fixed-income securities having equal credit quality but varying maturity dates. Historically, the yield curve has taken on three fundamental shapes; normal, inverted, and flat.
A normal yield curve is one in which long-term rates are greater than short-term rates, and thus, has an upward slope. A flat yield curve reflects a state where yields are the same across all maturities. An inverted yield curve is where long-term rates are less than short-term rates, giving the curve a downward slope. Under normal circumstances, the yield curve is upward sloping to reflect the natural extension of the higher risks associated with long maturities and to compensate for the opportunity cost. Depending on the economic conditions, the yield curve can experience parallel and nonparallel shifts. It is relatively rare for the curve to be inverted, and such phenomena have been traditionally linked with recessions. In fact, most U.S. recessions since the 1950s have been preceded by an inverted yield curve, making it one of the best indicators of a shifting economic cycle.
Naturally, the yield curve would flatten before it begins to invert, and this would occur due to a rise of short-term rates by more than long-term rates or a fall in long-term rates at a faster pace than short-term rates.
As of March’s end, the state of the U.S. yield curve is flat if we are to be guided by the spread of ten over two-year U.S. Treasuries (2/10 Treasury spread). This spread has recently been narrowing significantly as the Fed tightens its policy to counter an extraordinary inflation. This 2/10 Treasury spread had typically been used to reflect the curve shape, given that the two-year Treasury yield captures short-term interest rates movements. Such a spread has had a mean of 110 basis points looking at data for the last ten years. The ten-year over five-year Treasuries spread have already inverted – seeing that the last ten years’ historical average for this spread is 57 basis points. Nevertheless, there is still the chance that the curve could revert to its normal position should the Fed begins selling its arsenal of long-dated Treasures and reduce its balance sheet once inflation targets are achieved.
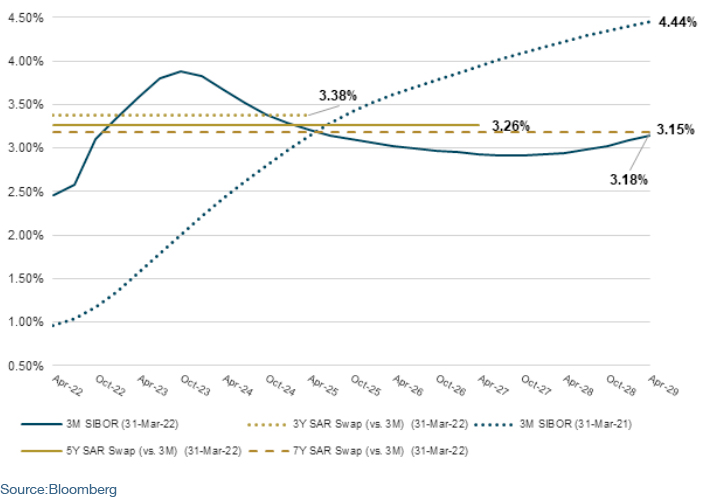
Similarly, the Saudi Riyal Swap Curve (where Saudi banks usually borrow and lend) is no different. At the time of writing, the spread between a seven-year swap and a three-year swap is around negative 20 basis points. The ten year historical average between those two swaps is 85 basis points. Likewise, the five-year swap had historically been priced at a premium of around 44 basis points (last ten years average) over the three-year swap. Currently, the five-year swap is less than the three-year swap by around 12 basis points, making the inversion in this part of the curve official as well. Looking at the short term, three months Saudi Arabian Interbank Offered Rate (SAIBOR) has recently breached the level of 2.40% (five-year historical average is 1.75%). The below graph illustrates the Saudi Riyal forward curve as of March 31st, 2022, and as compared with one year ago.
As central banks continue to increase interest rates to curb inflation, short-term borrowing rates tend to rise. This could impact a broad range of consumer and commercial loans. Thus, making borrowing more expensive for consumers, including small business loans, mortgage rates, and credit cards. This, in turn, has the potential to slow economic growth. Unlike a steep and normal yield curve, where banks can borrow at short term (lower interest rates) and lend at longer term (higher interest rates), a flat or inverted curve can pressure banks’ margins and discourage lending. Hence, an inverted yield curve can indicate economic sentiment and may suggest a poor long-term outlook. Yet, many would argue against this interpretation, as there are other explanations for the inversion that do not suggest the possibility of a recession.
IMPLICATION ON HEDGING
Since the start of the year, hedge deal activity in Saudi has considerably increased across corporates in various industries. This has been an expected outcome given the big movements in the curve and the rapid increase in short term rates, particularly three months SAIBOR. The majority of entities who have hedged and fixed their SAIBOR in the last two years are experiencing a material boost in their mark to market (MtM) derivatives valuations.
Indeed, we have received several queries concerning restructuring some ineffective hedges and the possibility of monetizing some of the deep in-the-money effective ones. On the other hand, should an entity considers hedging this year – we believe it is not too late, and as long as it is being done for the right reasons. The current shape of the curve provides an opportunity for corporates to increase the maturity of their hedges to cover longer term risk and satisfy risk management objectives. For example, it costs about the same now to exchange floating cash flows for fixed on a seven-year hedge as it does by doing so for three years.
In these volatile times, we couldn’t emphasize enough the importance of putting the measures to establish the related KPIs and thresholds that would define an entity’s desired hedge ratio and future hedging requirements. Plenty of research has shown that timing the market is close to impossible and will usually result in the formation of a flawed hedging strategy. The alternative is to introduce an element of consistency and pursue a pre-defined hedge plan that would cater to an entity’s financial risk management objectives beyond the changing landscape of economic cycles.

Partner